Overview

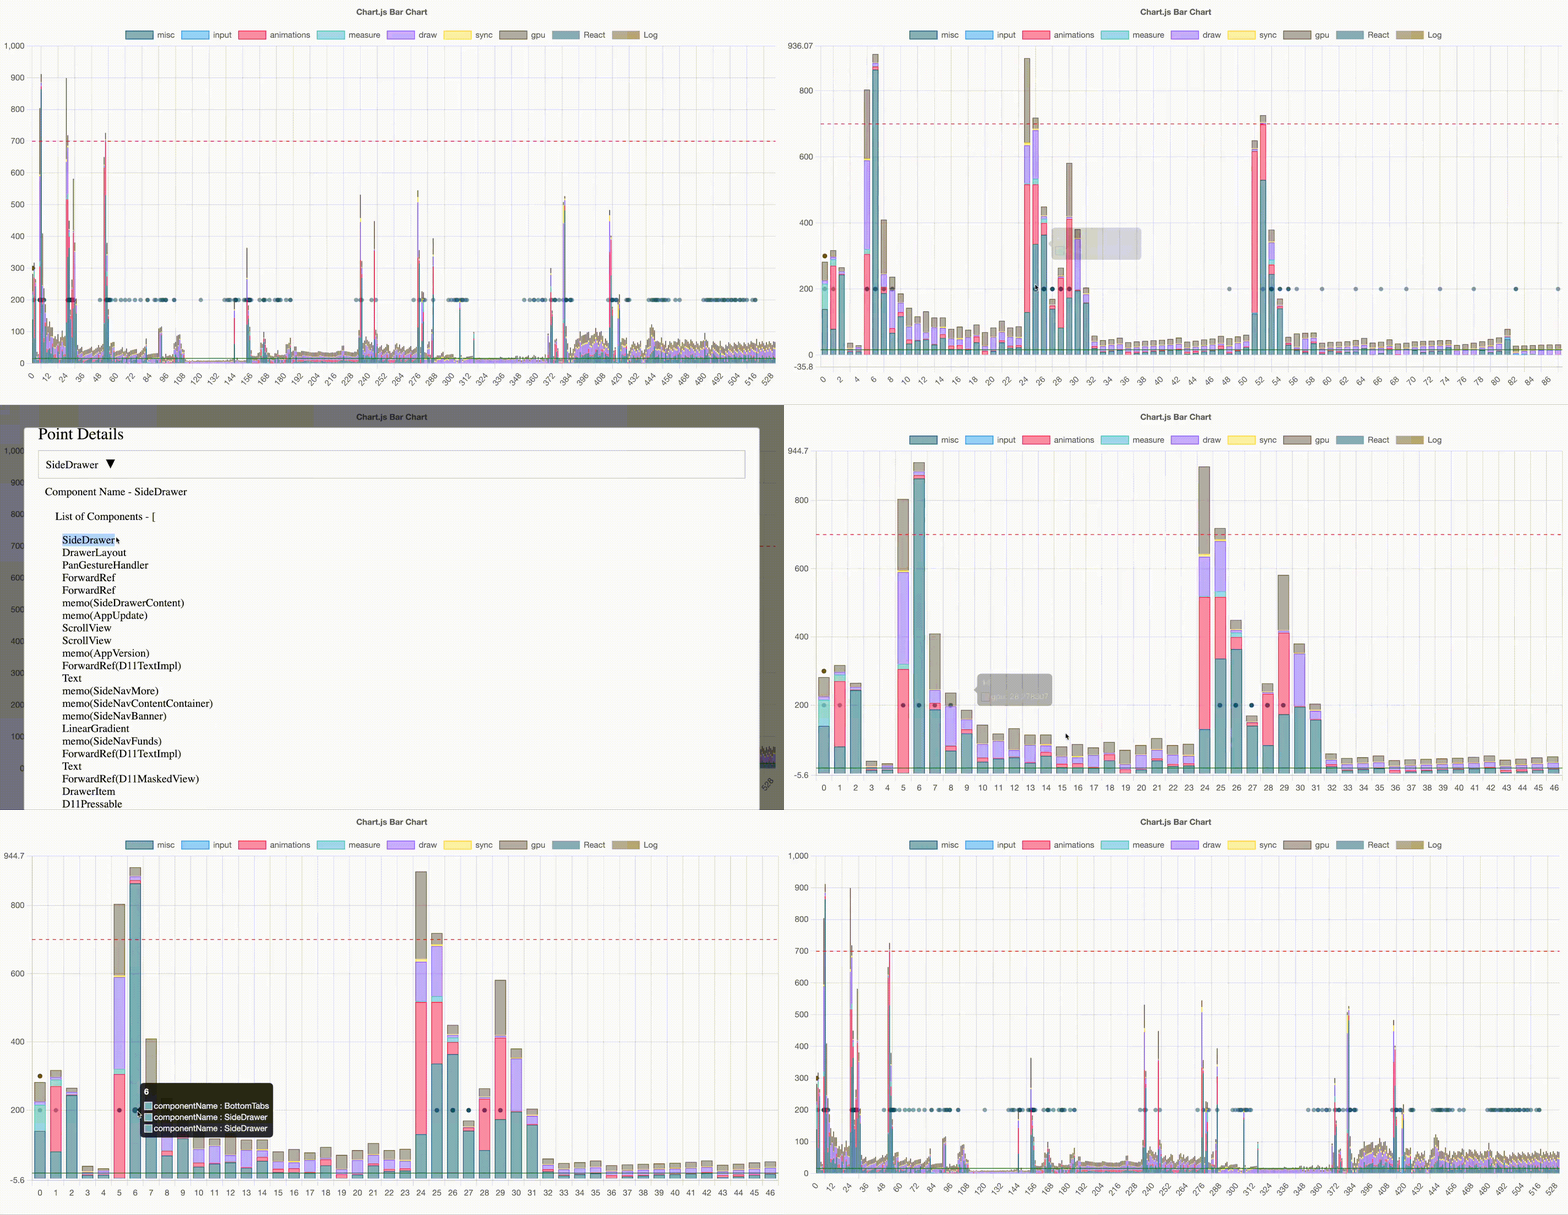
The De-frost visualization tool offers an interactive dashboard to analyze performance data, focusing on:
Key Features
Android Frames
Analyze the time taken at each rendering stage, divided into colored segments for better clarity.
React Native Commits
How we are going to imagine React Native commits and their relation with frames.
How to Identify Problems
Correlate React commit events with frame rendering performance using scatter points.