Android Frames
Lets understand the bar graph in differents segments
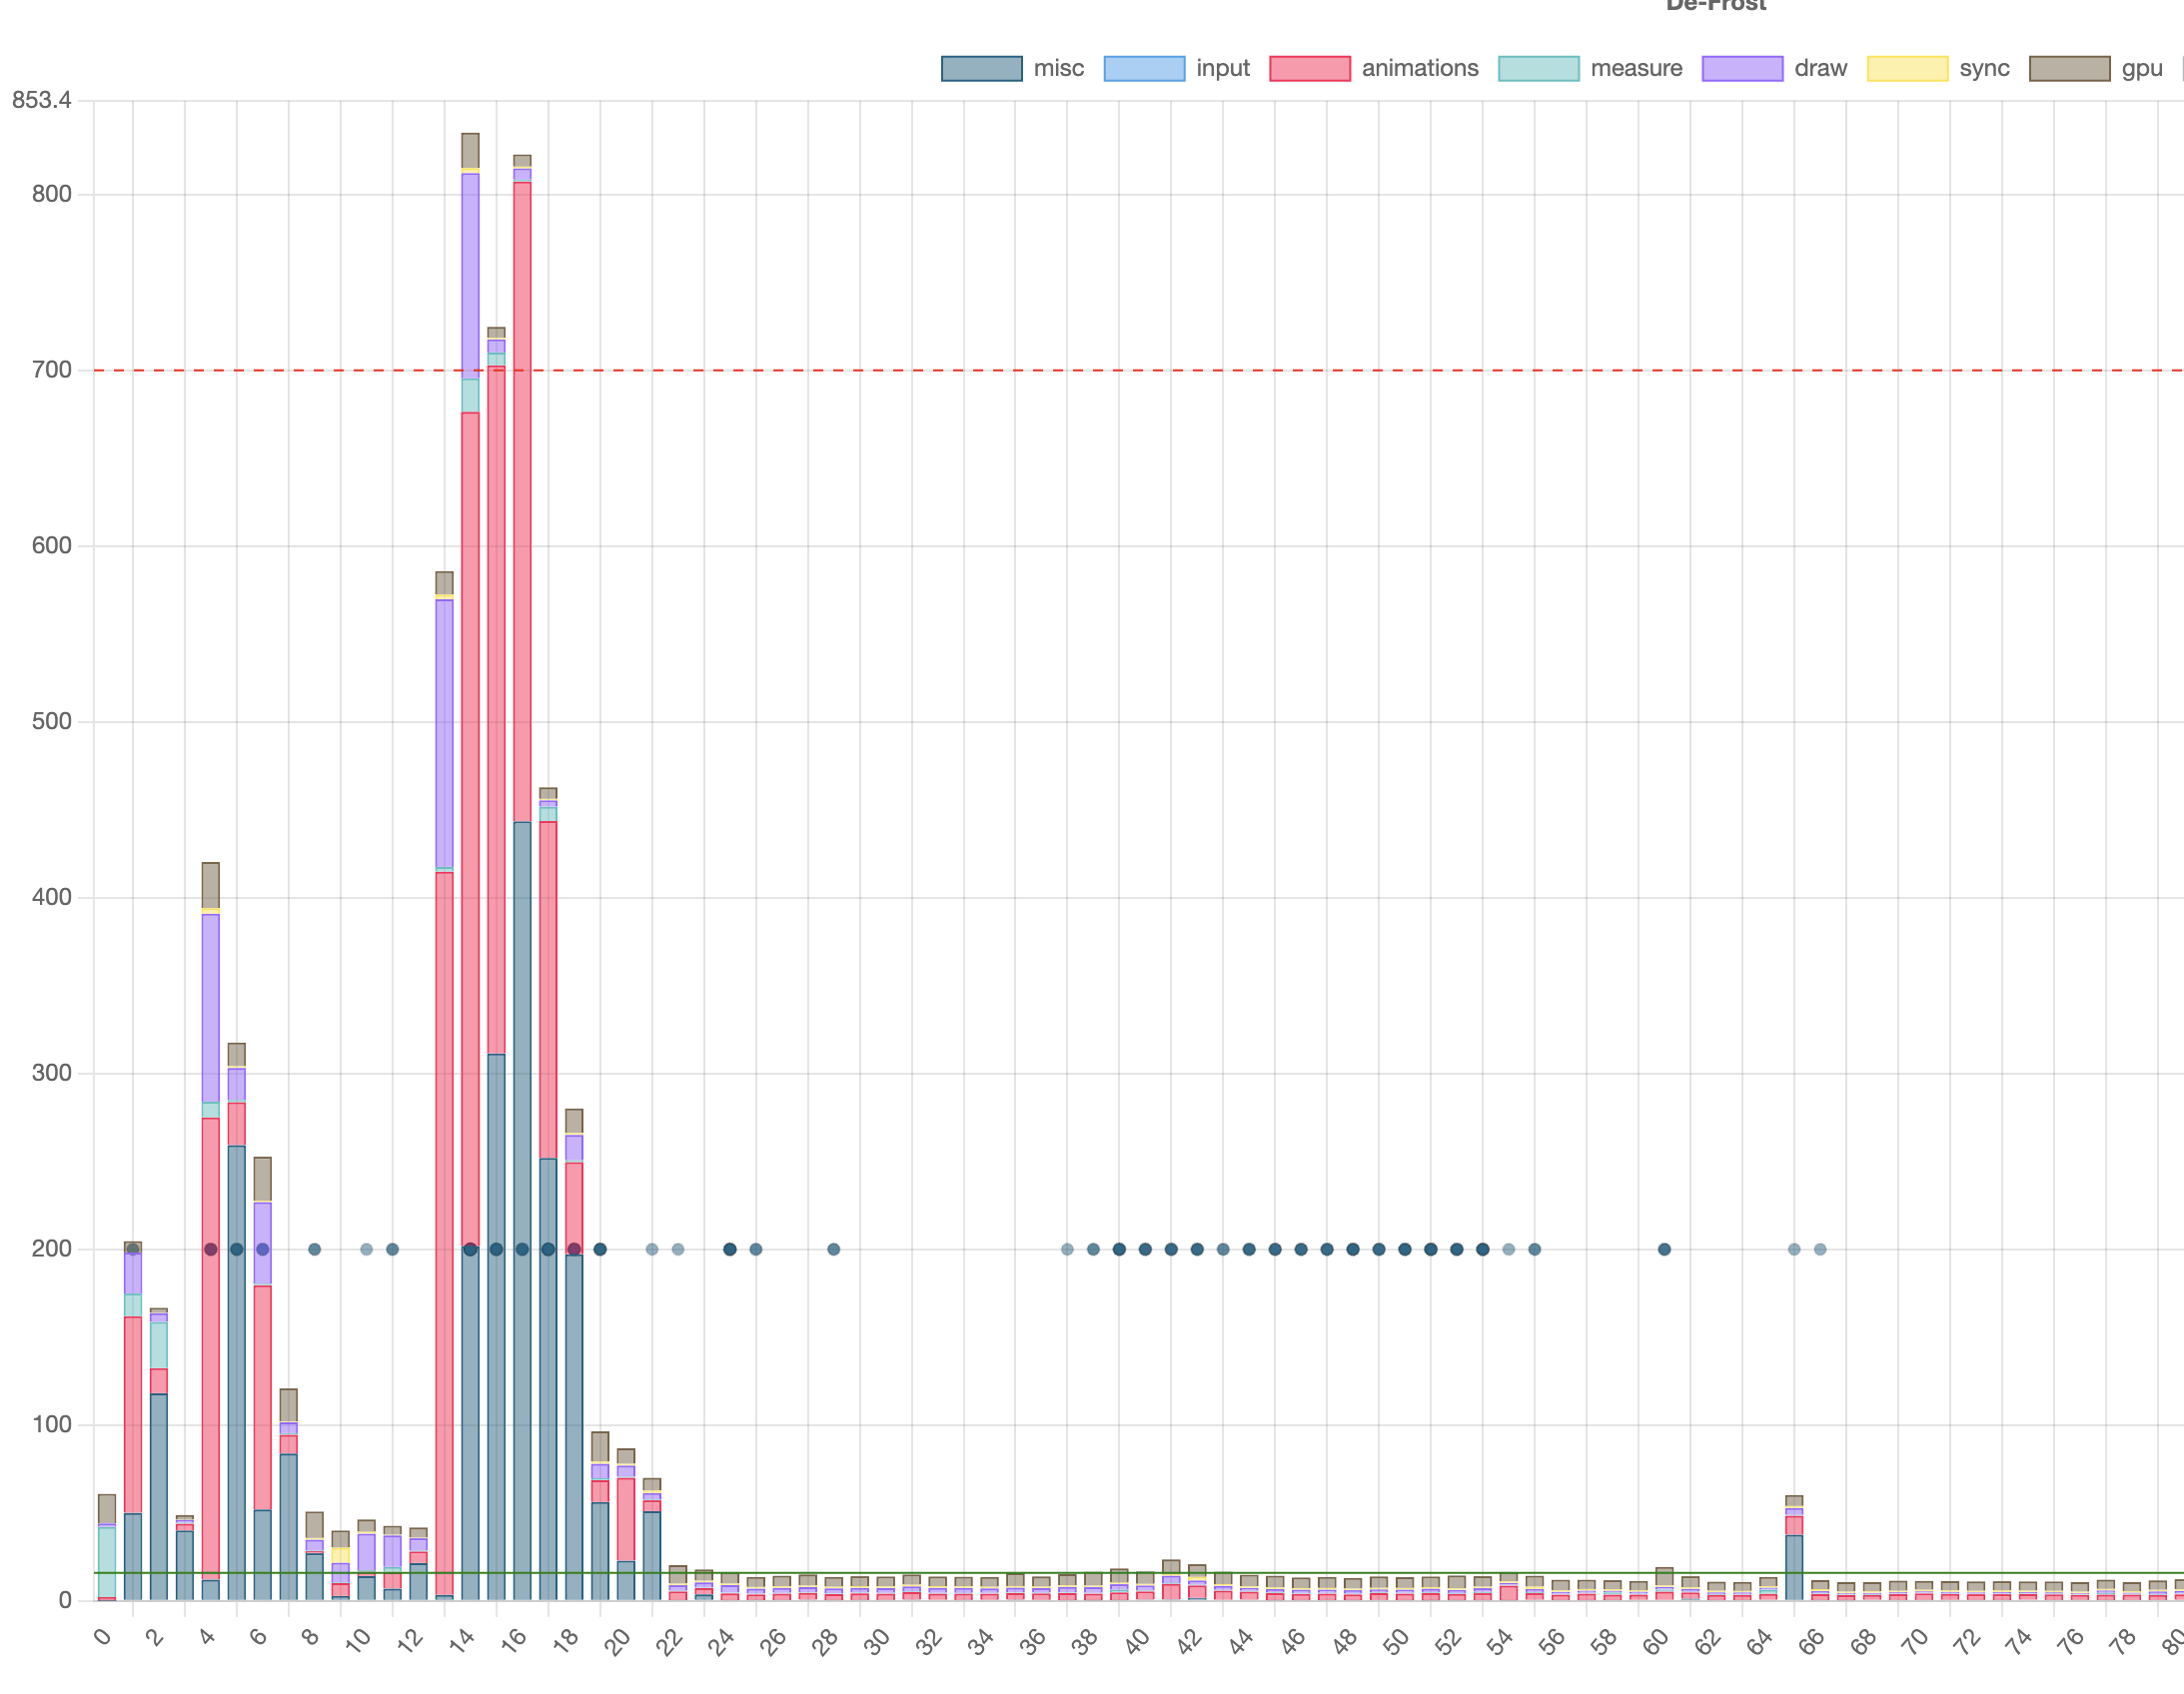
Structure
- X-Axis: The contains frames indexes. It is just a number which helps us to organize frames in timely fashion
- Y-Axis: Total time taken by a frame for rendering in milliseconds.
- Red Dashed Line: Threshold line for Frozen Frames (render time > 700ms).
- Green Line: Threshold line for Slow Frames (render time > 16ms).
Bar Segments
Each bar is divided into segments, representing rendering pipeline stages:
Vsync / Misc: Accounts for non-rendering work on the UI thread; consider offloading tasks to background threads to avoid delays.
Input Handling: Measures the time spent handling input event callbacks; optimize complex event handling or offload to separate threads.
Animation: Tracks the time needed to evaluate animators like ObjectAnimator or ViewPropertyAnimator; high values indicate expensive animation logic.
Measure / Layout: Calculates view sizes and positions; large times suggest deep or inefficient view hierarchies.
Draw: Captures commands for rendering UI elements; spikes occur with invalidated views or complex custom onDraw() logic.
Synchronization: Transfers bitmaps from CPU to GPU; optimize large or numerous resources to reduce overhead.
GPU Rendering: Executes rendering tasks using the GPU.
Identifying Frozen Frames
- Frames with a total rendering time exceeding 700ms are classified as frozen frames.
- The red line represents the frozen frame threshold.
- Focus on reducing the height of the highest segments to optimize performance.