Android Frames
Let's understand the bar graph in different segments
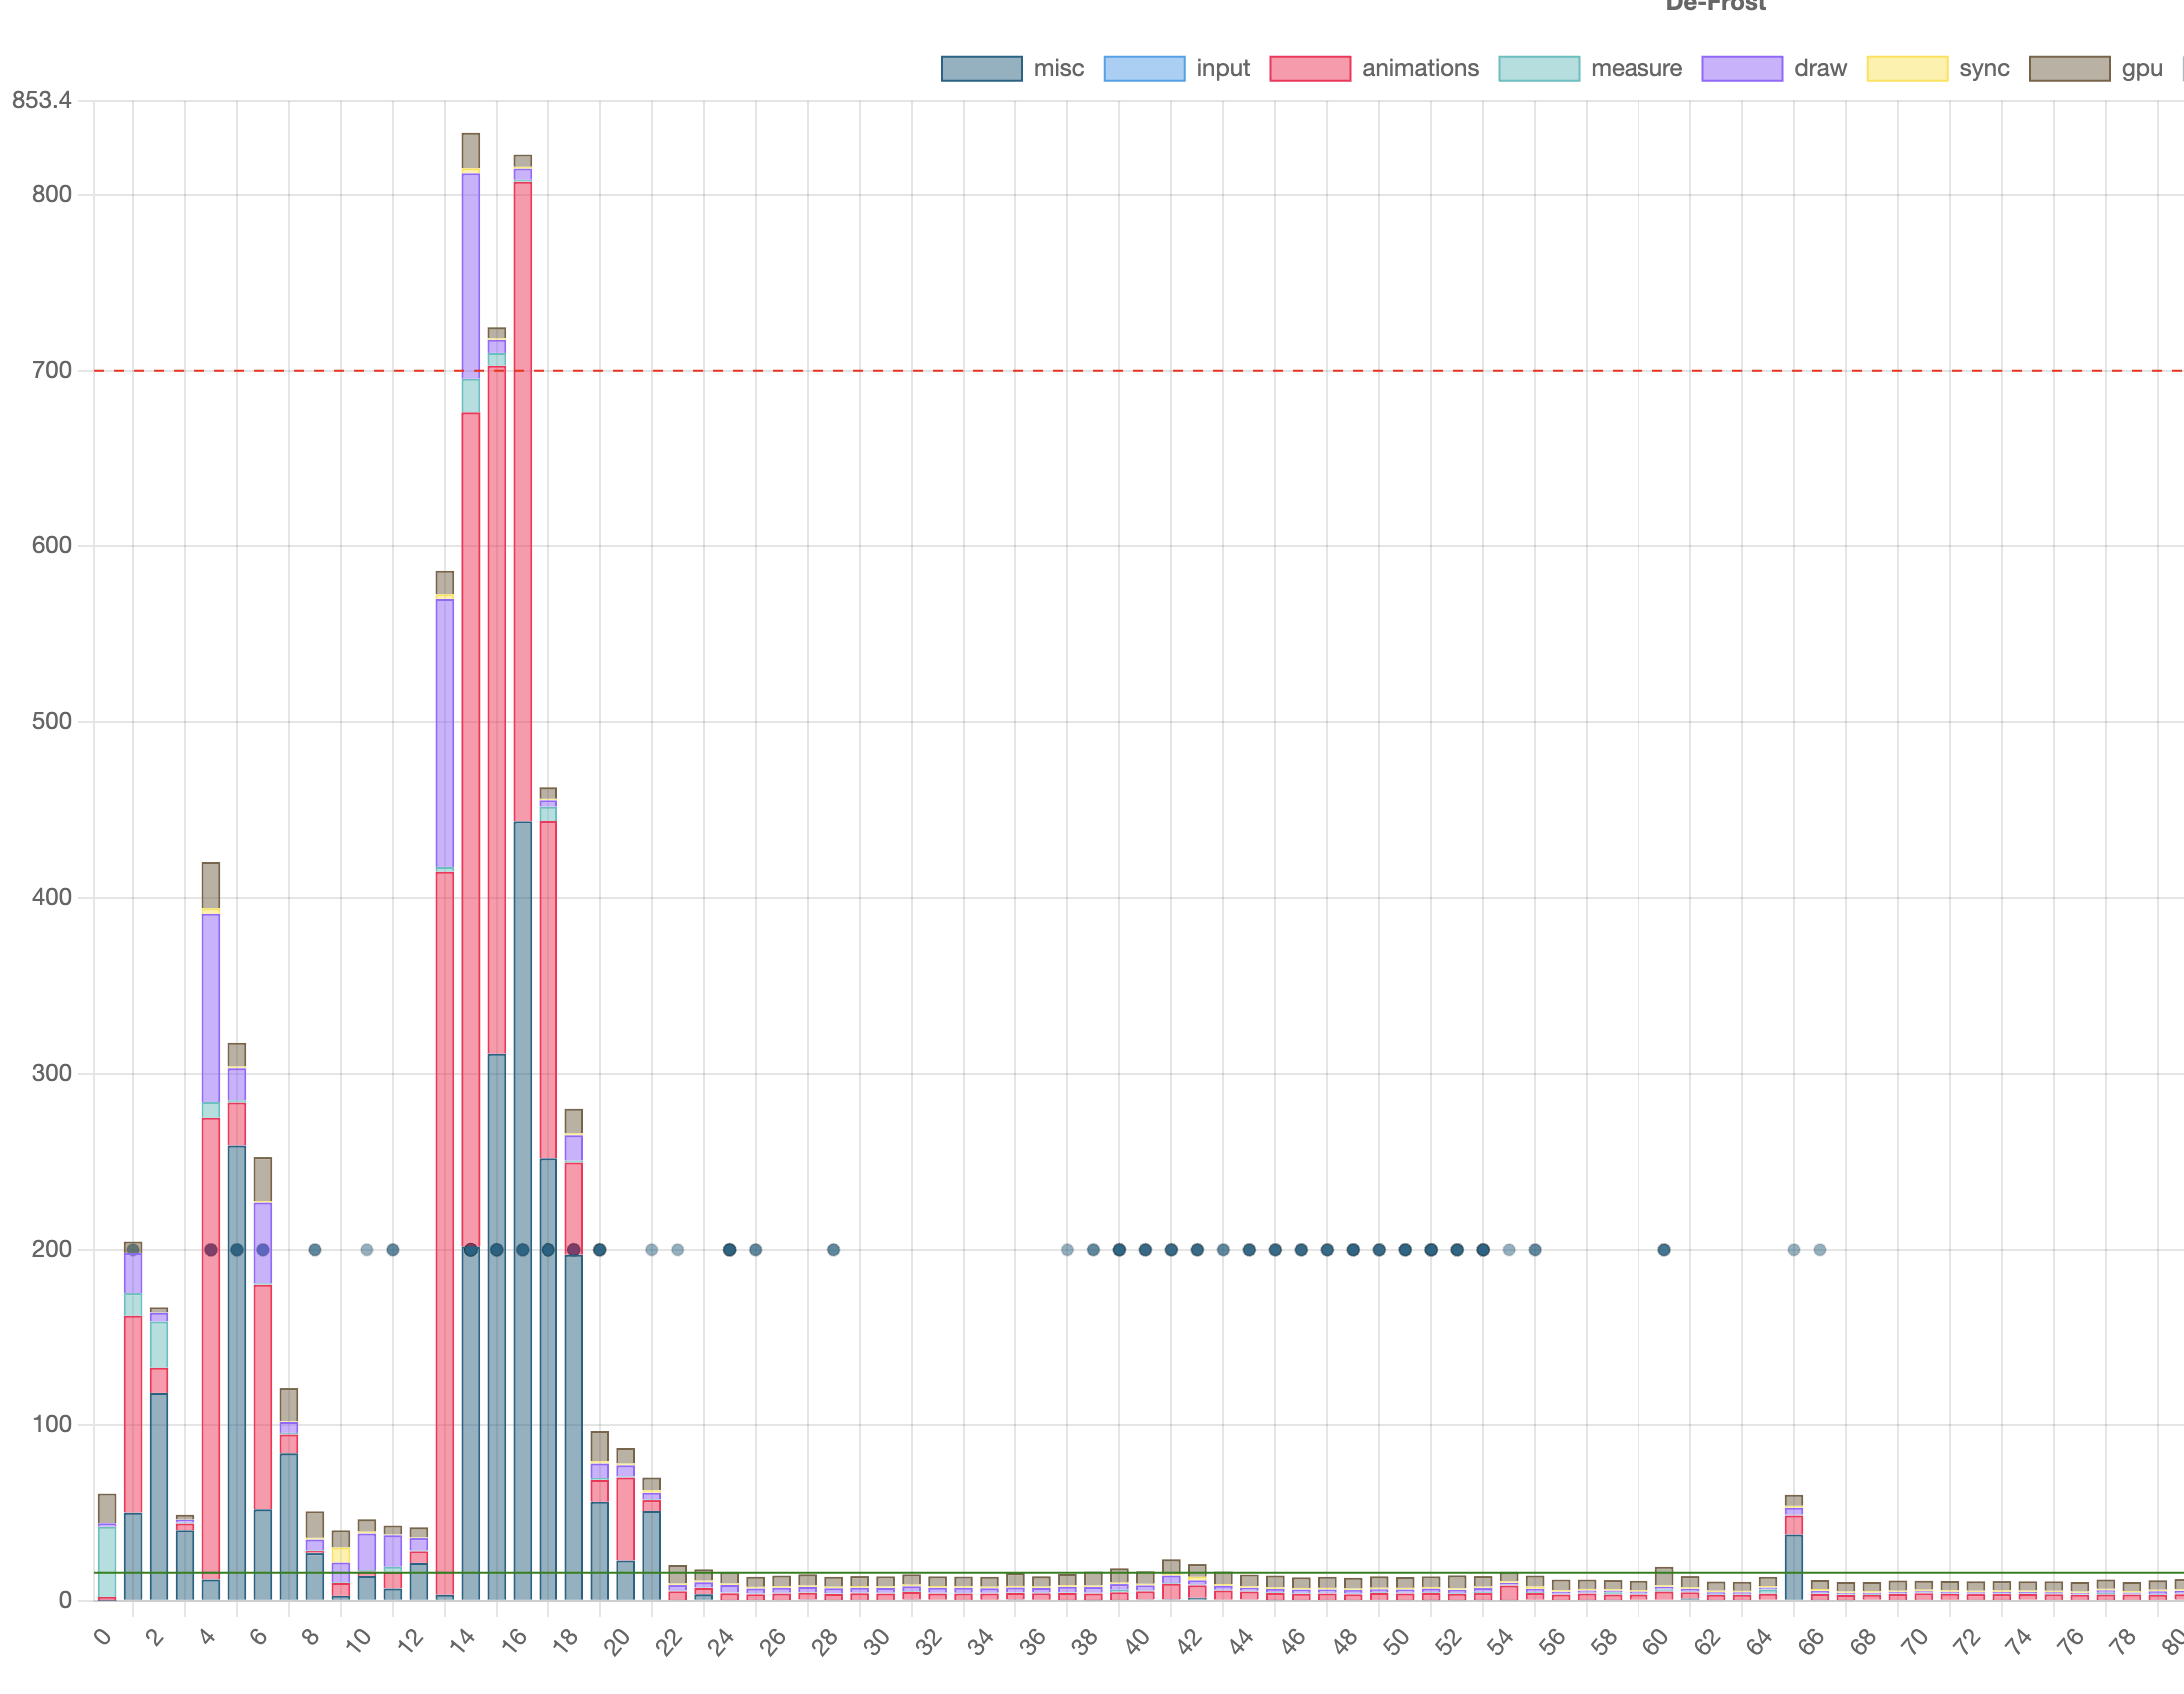
Structure
- X-Axis: Contains frames indexes. It is just a number which helps us to organize frames in timely fashion
- Y-Axis: Total time taken by a frame for rendering in milliseconds.
- Red Dashed Line: Threshold line for Frozen Frames (render time > 700ms).
- Green Line: Threshold line for Slow Frames (render time > 16ms).
Bar Segments
Each bar is divided into segments, representing rendering pipeline stages:
Vsync / Misc: Accounts for non-rendering work on the UI thread; consider offloading tasks to background threads to avoid delays.
Input Handling: Measures the time spent handling input event callbacks; optimize complex event handling or offload to separate threads.
Animation: Tracks the time needed to evaluate animators like ObjectAnimator or ViewPropertyAnimator; high values indicate expensive animation logic.
Measure / Layout: Calculates view sizes and positions; large times suggest deep or inefficient view hierarchies.
Draw: Captures commands for rendering UI elements; spikes occur with invalidated views or complex custom onDraw() logic.
Synchronization: Transfers bitmaps from CPU to GPU; optimize large or numerous resources to reduce overhead.
GPU Rendering: Executes rendering tasks using the GPU.
Identifying Frozen Frames
- Frames with a total rendering time exceeding 700ms are classified as frozen frames.
- The red line represents the frozen frame threshold.
- Focus on reducing the height of the highest segments to optimize performance.
tip
Frozen frames typically occur when one or more stages (e.g., layout or draw) take excessively long to complete. For more details visit https://developer.android.com/topic/performance/rendering/profile-gpu